On the sensitivity analysis page in the case, the user works with the available scenarios and can also enter values in user-defined scenarios where applicable.
The purpose of the page is to test how changed assumptions affect the company’s repayment ability and financial development. The available default scenarios come from the bank’s settings, but the user works with them in the case context.
On the result tab, the user compares Actual and scenario outcomes and sees how repayment ability, KPI:s, and some key financial posts are affected. The result view includes a broader KPI presentation than before, including DSCR.
Below the scenarios, the user can write a comment to the analysis. Depending on the bank’s setup, the comment and the sensitivity analysis result can be included in the Credit PM.
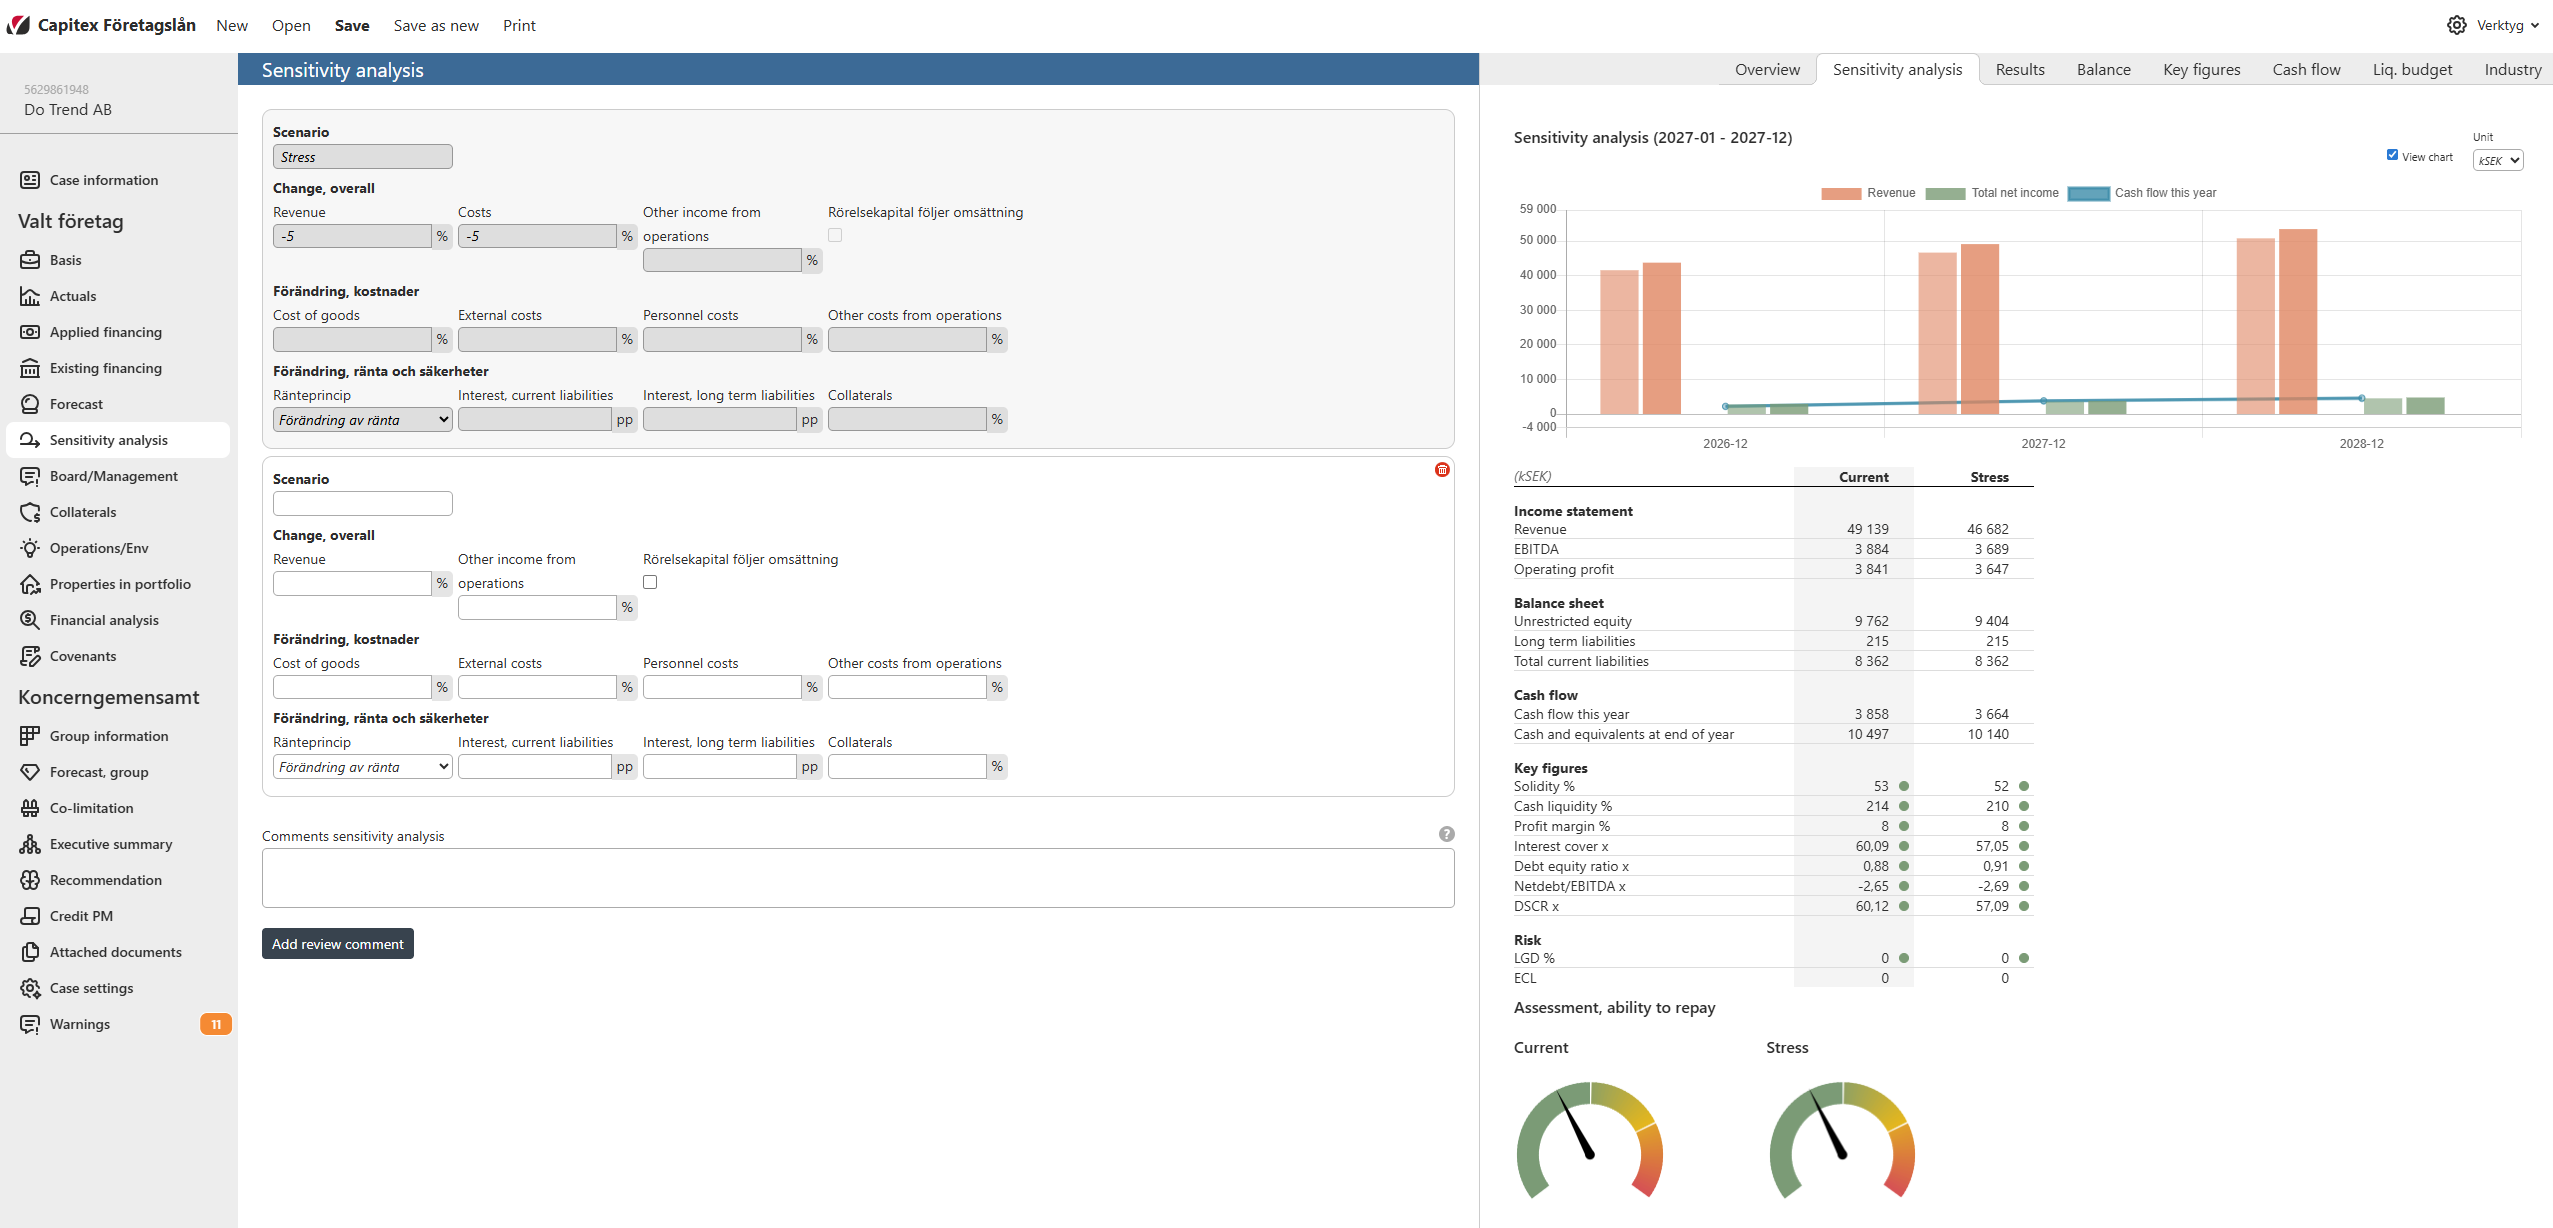
How to interpret the meters regarding colors
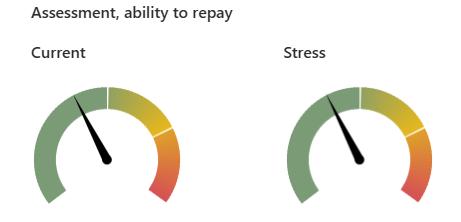
In general, the following applies:
Green means that this forecast says that the company can take the loans they are applying for and still perform above green KPI thresholds for all KPIs in the upcoming fiscal year.
Yellow means that they will perform above red KPI thresholds for all KPIs.
Red means that at least one KPI will fall below the red threshold if the company takes the loans.
The “forecast” can be based on different scenarios:
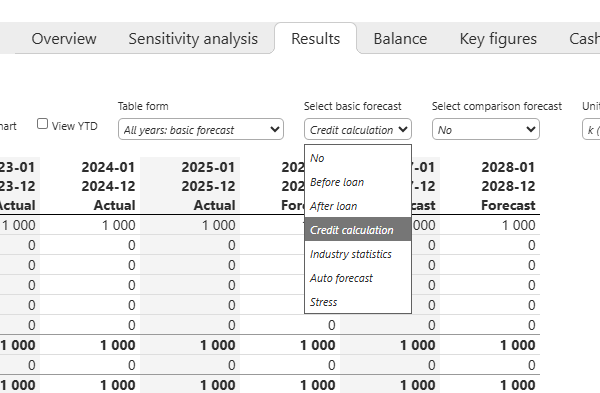
Current: corresponds to “After loan” in the forecast selection on the right-hand side of the GUI. This meter is based on the forecast of the upcoming fiscal year without respect to modifications made by sensitivity analysis settings or credit rules.
Credit calculation: on some configurations a credit calculation meter is shown. This meter is based on the forecast of the upcoming fiscal year if the credit rule settings are applied. Corresponds to “Credit calculation” in the forecast selection.
Other meters: there can be up to two other meters whose names correspond to the two first configured sensitivity analysis scenarios on the Sensitivity Analysis page. These are based on the forecast of the upcoming fiscal year if their respective sensitivity analysis settings are applied. These forecasts are also available for viewing in the forecast selection by selecting their names.
The precise edge values of the meters
A frequently asked question is “how can a meter be more or less green?” This is an attempt to answer this question.
The meters assess the company’s repayment capacity. This is done by computing algorithmically how big of a loan the company could hypothetically take while still staying within the configured KPI thresholds.
How big of a loan can the company take while the KPIs for the upcoming fiscal year stay green?
How big of a loan can the company take while the KPIs for the upcoming fiscal year are non-red?
By comparing these hypothetical loan amounts to the actual loan amount, a distance can be computed. This is what is shown by the meters.
A repayment capacity score of 100 means that the company is well below the maximum loan amount and could probably loan quite a bit more money while still performing within the KPI thresholds.
A repayment capacity score of 50 means that the company is very close to their maximum loan amount and if they were to loan any more money, they would likely be degraded to yellow status.
A repayment capacity of 24 means that the company is very close to yellow status, but the loan is large enough for their KPIs to go red. If they were to loan just a little less, they would likely be upgraded to yellow status.
And so on. This is what the meters mean on a conceptual level.
An example
Applied loan: 6 000 000 SEK
Loan term: 12 months
Interest: 5%
Payment period: once per year
Threshold for interest cover: >= 3.8 times is green, >= 2 times is yellow
The credit calculation simulates an interest of 10% instead of 5%
Simply explained the interest cover is a KPI that divides the income by the financial costs.
“After Loan” forecast
The interest each year is 5% of 6 000 000 SEK = 300 000 SEK.
The “After loan” forecasts the upcoming fiscal year’s income to 3 300 000 SEK.
So the interest cover KPI becomes 3 300 000 SEK / 300 000 SEK = 11 times.
11 times is far above 3.8, so the KPI is green.
The maximum loan is probably a lot higher than 6 000 000 SEK, and the score is close to 100.
“Credit calculation” forecast
The interest each year is now 10% of 6 000 000 SEK = 600 000 SEK.
The “Credit calculation” forecasts the upcoming fiscal year’s income to 2 000 000 SEK.
So the interest cover KPI becomes 2 000 000 SEK / 600 000 SEK = 3.33 times.
3.33 times is below 3.8 but above 2, so the KPI is yellow.
The repayment capacity score lands somewhere between 25-50.
“Credit calculation” forecast with reduced loan amount
If we reduce the loan amount to 5 200 000 SEK, the interest each year is now 520 000 SEK.
The income is unchanged at 2 000 000 SEK.
So the interest cover KPI becomes 2 000 000 SEK / 520 000 SEK = 3.85 times.
3.85 times is above 3.8, so after reducing the loan amount the KPI is now green.
The maximum loan is probably very close to 5 200 000 SEK, and the score is close to 50.
Conclusion
Because the maximum loan amounts are calculated in respect to all of the KPI thresholds, the meters indicate the distance to a loan amount that would cause any KPI to change its color.