The Risk tab contains all settings that control how credit risk is evaluated in the system. Here the bank defines threshold values for financial KPIs, how risk classes are linked to the probability of default (PD), and how PD and LGD should be interpreted in the risk assessment. These settings affect several parts of the credit analysis, including risk indicators, visual risk meters, and the internal risk class assigned to a company.

Risk Meters in the Credit Assessment
Risk Meters in the Credit Assessment The system presents risk information using visual meters in the credit assessment. These meters display the company’s risk level based on the settings defined in this tab. The colors in the meters are determined by the threshold values defined for KPIs, PD, and LGD, helping the user quickly identify the level of risk.
KPI Threshold Values
In this section the bank defines which levels of different financial KPIs should be classified as green, yellow, or red in the risk assessment. The system uses these thresholds when presenting KPI values in the credit analysis. The colors indicate the level of risk:
Green – very low or low risk
Yellow – normal risk level
Red – high or very high risk
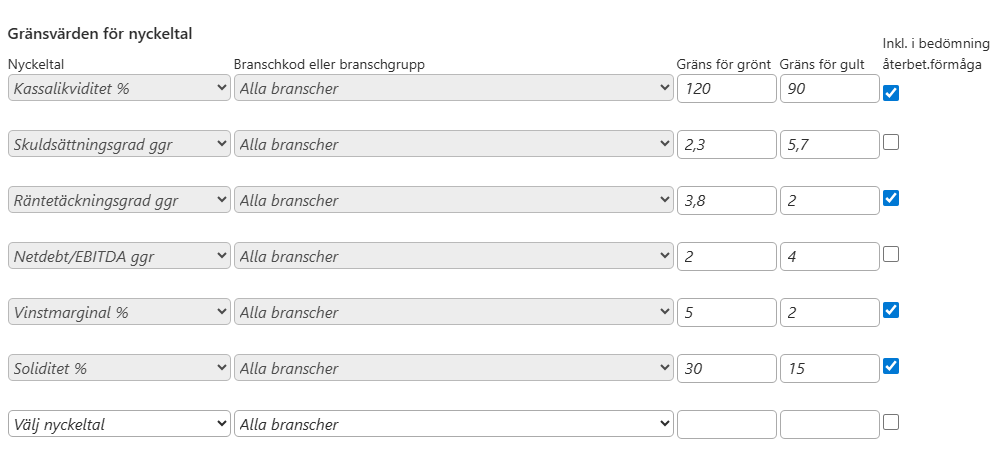
For each KPI the bank can define:
Green threshold – the worst level where the value is still considered strong (green).
Yellow threshold – the worst level before very high risk (red).
Industry – allows different thresholds to be defined for specific industries.
Include in repayment ability assessment – determines whether the KPI is included in the meter that evaluates repayment ability.
You select a KPI in the last row if you want to override the base thresholds for a specific industry or industry group (see the “Branchgrupper / Industry groups” page) or if you want to add thresholds for a new KPI that doesn’t have any thresholds yet.
Risk Classes
This section defines the relationship between a risk class and the PD (Probability of Default) used in the credit assessment. PD represents the probability that a company will fail to meet its financial obligations within 12 months. For each risk class the following can be defined:
PD 12 months – the PD level associated with the risk class.
Show warning – if selected, a warning will be shown when this risk class occurs.
Warning text – optional text displayed together with the warning.
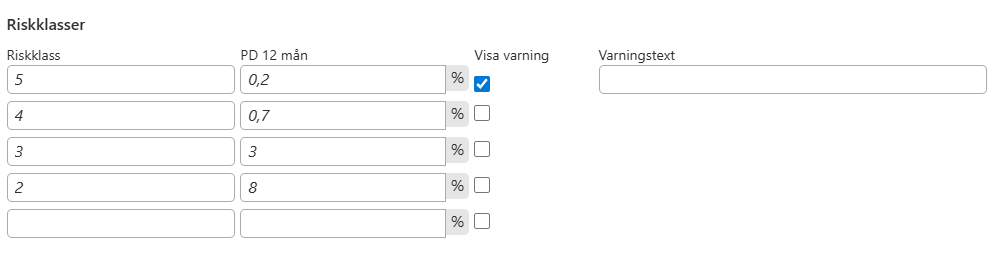
You add a new mapping for a risk class by entering values in the last row.
LGD and Credit Information Age
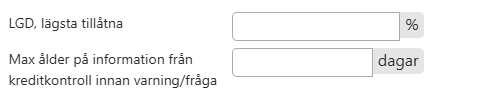
This section contains additional risk-related parameters. LGD – Minimum allowed LGD (Loss Given Default) represents the share of an exposure that the bank expects to lose if a borrower defaults. Here the bank can define a minimum allowed value. Maximum age of credit report information Defines how old information from a credit report may be before the system displays a warning or asks whether a new credit check should be performed.
Internal Risk Classes
In this section the bank defines its internal risk classes. These classes are used throughout the credit process and in documentation such as the credit memorandum (Credit PM). The internal risk classes represent the bank's internal credit policy and categorize companies according to their estimated risk level. You can have up to 10 different internal risk classes.
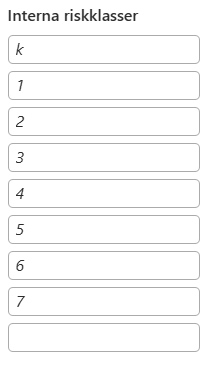
You add a new internal risk class by entering a value in the last row.
Conversion from PD to Internal Risk Class
Credit reporting agencies (for example UC or Bisnode) often provide a PD value that represents the probability of default. In this section the bank defines how these PD ranges should be converted into the bank’s internal risk classes. For each interval the following is specified:
PD from – the lowest PD value in the interval.
PD to – the highest PD value in the interval.
Internal risk class – the internal class that should be assigned.
This makes it possible to automatically translate external credit risk data into the bank’s internal risk classification and present it in the credit memorandum.
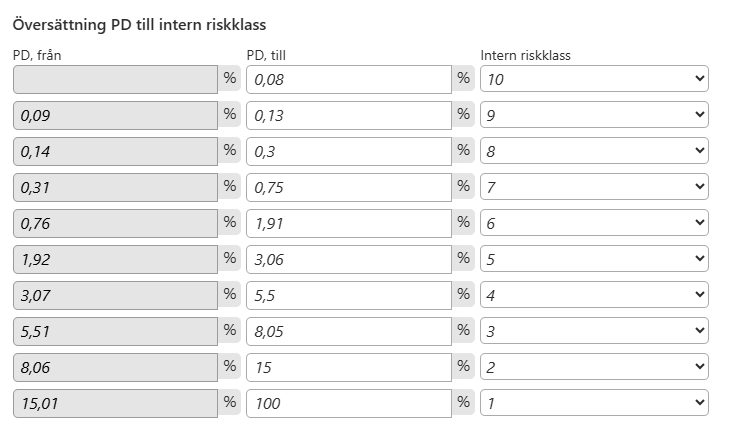
You can have up to 11 intervals in the mapping between PD and internal risk class. You add a new interval by changing the value of PD to and selecting “Internal risk class”. You remove a mapping by clearing the value in PD to for a specific mapping.
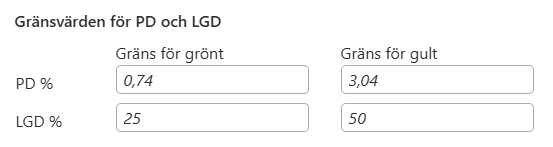
PD and LGD Threshold Values
Here the bank defines which PD and LGD levels should be classified as green, yellow, or red in the system’s risk meters. PD – probability of default. LGD – loss given default. These values are used in the visual risk meters within the credit assessment and determine how the risk level is presented in the system’s analysis views.