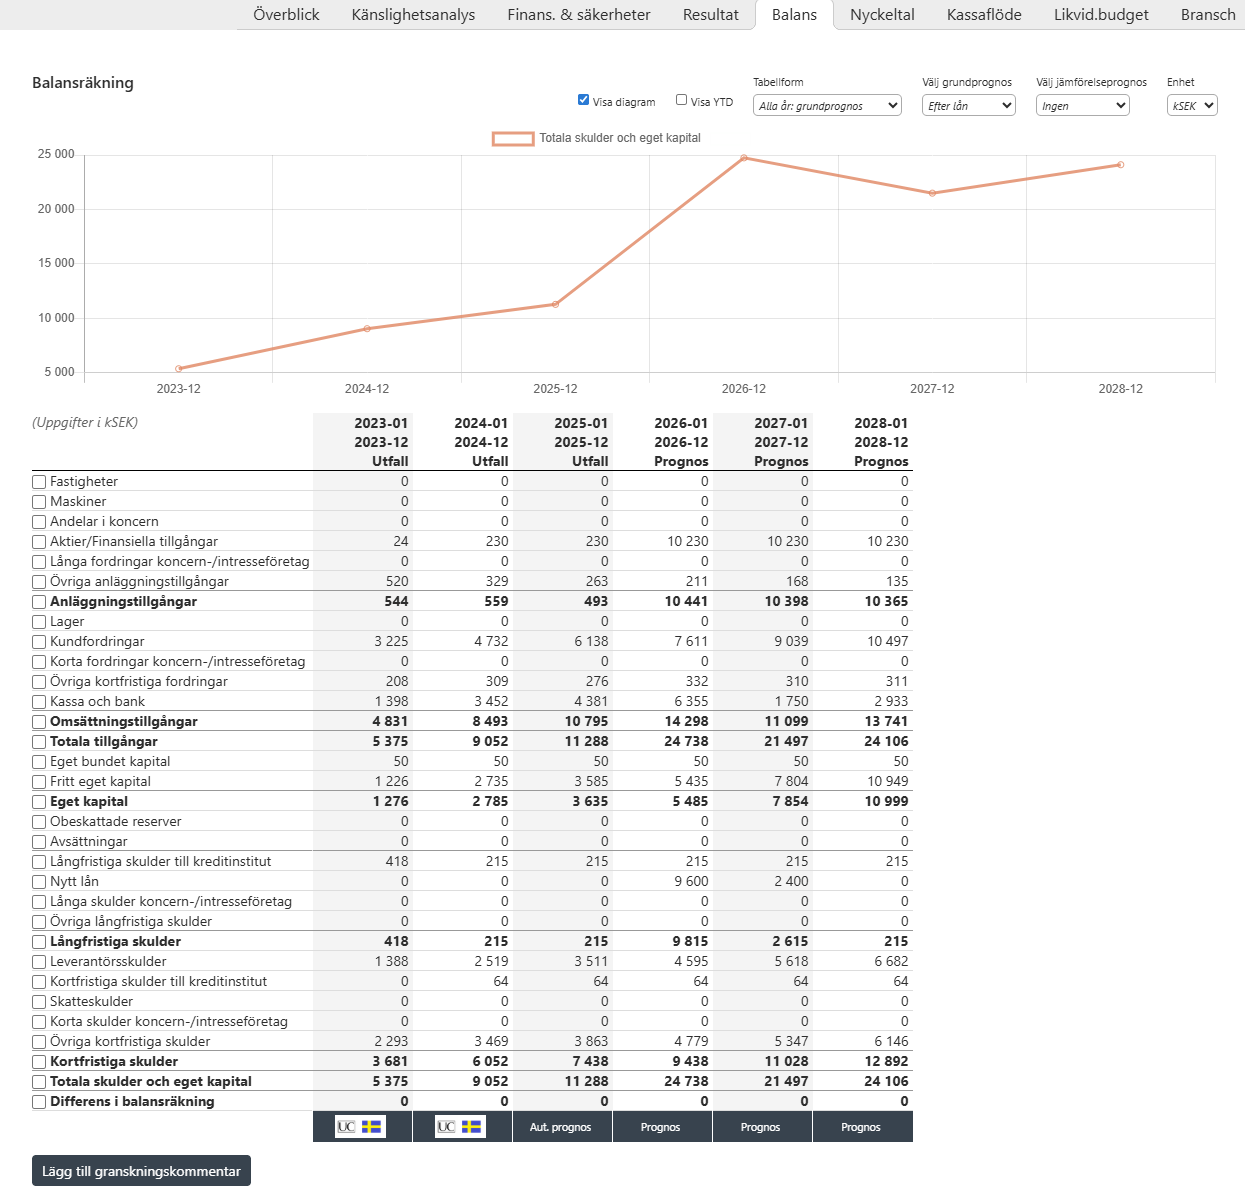
Here, three years actual results and three years forecasts are shown at a detailed level. Forecasts are calculated automatically by the regulations set out in Capitex Corporate Loans. Forecast figures can be changed and you do so on Page Forecast.
To show a specific item development historically and forecast ahead, mark in the "box" next to it ("Properties", "Accounts payable" etc) and it will be shown how these have developed historically and what the forecast is ahead. You can also select several to compare how different items have developed relative to each other.
The drop-down fields "Select basic forecast" and "Select comparison forecast" above the graph - there you specify which graphs are to be displayed.
The options available are "Efter lån" / After loan, "Före lån" / Before loan, "Branschstatistik" / Industry statistics and “Auto.prognos” / Auto forecast, explanation below:
Efter lån / After loans, is how the company's financial figures develop with regard to applied for financing.
Före lån / Before a loan is how the company's financial figures are forecast without regard to new financing.
Branschstatistik / Industry statistics are applicant companies' financial figures in relation to how similar companies in the same industry perform.
Auto.prognos / Auto forecast represents the financial forecast excluding manual adjustments, such as answers to future questions or a manually specified prognosis.
You can chose to view a single company, every company in the case or the Group (change seleted view via "Urval")
Image