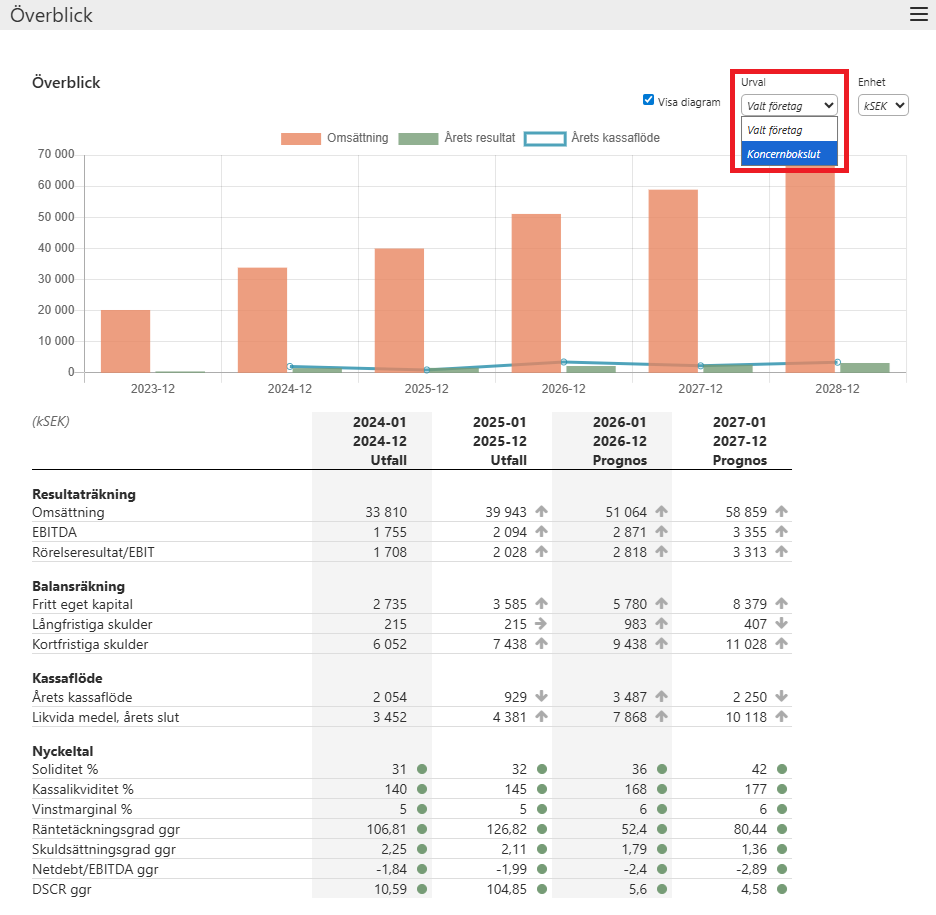
This view provides a quick overview of how the company or a Group has performed historically and show a forecast for the next two years.
The graph shows bars for Sales, Profit and Cash Flow (as a line).
Selected key figures are presented and how they have been for the most recently reported years and how they develop after loans and compared with credit calculations. For each key figure, a colour is presented. Simplified, Green is good, Yellow ok and Red is less good / bad. The thresholds of these colours can be seen and customized in the settings dialogue under the tab “Risk”.
Credit calculations (optional, and not visible in this example picture) are calculated so that specified financing is repaid in accordance with established regulations, ie with a certain repayment period and at a certain interest / commission, etc.
You can choose between looking at Overview for an individual company or for the consolidated financial statements for the entire Group
Image