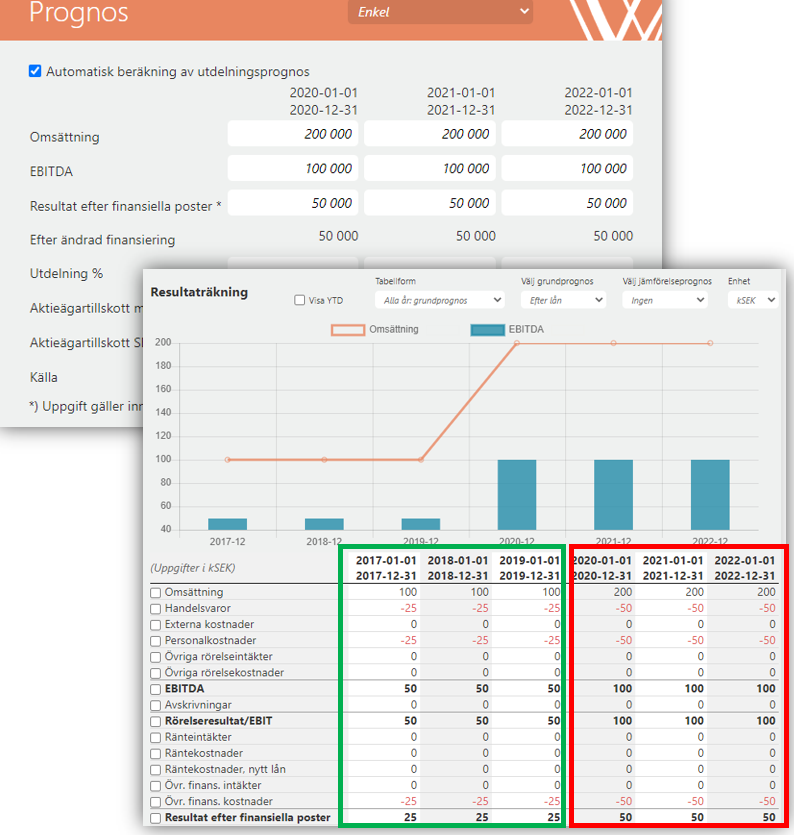
In the example beow, the historical outcome has been according to the picture “Income statement” (marked in green below) for the years 2017-2019, ie the three left columns as below:
Omsättning / Turnover 100
Handelsvaror / Merchandise -25 ie 25% of Sales,
Personalkostnader / Personnel costs -25 ie 25% of Sales
EBITDA 50 i.e. 50% of Sales
Resultat efter finansiella poster / Profit after financial items 25 ie 25% of Sales.
Original Forecast was “Flat”, ie the same figures for each item (Sales / Omsättning, Merchandise / Handelsvaror, etc.) also for the three forecast years.In Simplified forecast / Enkel prognos, we change so that Sales, EBITDA and Profit after financial items increase by 100%. This means that the other items must increase by 100% so that they maintain their relative size. This means that the other items in Income statement that can not be adjusted via Simplified forecast also increase by 100% so that they maintain their relative size.
For the forecast years 2020 - 2022 (marked in red) you can see that Commodities, Personnel costs, EBITDA and Profit after financial items have maintained their relative size as below:
Omsättning/ Turnover 200
Handelsvaror / Merchandise -50 ie 25% of Sales,
Personalkostnader / Personnel costs -50 ie 25% of Sales
EBITDA 100 i.e. 50% of Sales
Resultat efter finansiella poster / Profit after financial items 50 ie 25% of Sales.
Picture
